Python in Excel Tutorial: Run Python Scripts Inside Your Spreadsheet
Python in Excel lets you write Python code directly in spreadsheet cells using the =PY()…
Python in Excel lets you write Python code directly in spreadsheet cells using the =PY() function — combining Excel’s familiar interface with Python’s powerful data analysis libraries like pandas, matplotlib, and scikit-learn. No local Python installation is required because code runs in the Microsoft Cloud. If you are new to Excel, start with our Excel tutorial for beginners before diving into Python.
Key Takeaways
- Type
=PY(in any Excel cell to enter Python mode — code runs in the Microsoft Cloud using an Anaconda distribution with pandas, NumPy, matplotlib, and more. - Use the
xl()function inside Python code to reference Excel ranges, bringing spreadsheet data directly into Python for analysis. - Python in Excel requires a Microsoft 365 subscription (Business, Enterprise, or Personal/Family in preview) — it is not available in standalone Excel 2024 or earlier.
How Do I Get Started With Python in Excel?
Type =PY( in any cell or go to Formulas > Insert Python to activate Python mode — Excel switches the cell to a Python code editor where you can write and run Python directly.
Prerequisites
| Requirement | Details |
|---|---|
| Subscription | Microsoft 365 Business, Enterprise, or Personal/Family (preview) |
| Platform | Windows (Mac in preview) |
| Internet | Required — code runs in Microsoft Cloud |
| Local Python | Not needed — cloud-based Anaconda distribution |
| Excel version | Current Channel, Microsoft 365 |
Your First Python Cell
- Open Excel and create a new workbook.
- Click on cell A1.
- Type
=PY(— Excel activates Python mode (the cell border turns purple). - Type your Python code, for example:
"Hello from Python!" - Press Ctrl+Enter to run the code.
- The cell displays the result:
Hello from Python!
According to Microsoft Support, Python cells are identified by a purple border and a PY icon in the cell corner. You can also access Python via Formulas tab > Insert Python in the ribbon.
How Do I Reference Excel Data in Python?
Use the xl() function inside Python code to read Excel cell ranges, named ranges, and tables — this bridges your spreadsheet data into Python variables for analysis.
Basic Reference
# Reference a single cell
value = xl("A1")

# Reference a range (returns a pandas DataFrame)
data = xl("A1:D100")

# Reference an Excel Table
sales = xl("SalesTable")

# Reference a named range
budget = xl("AnnualBudget")
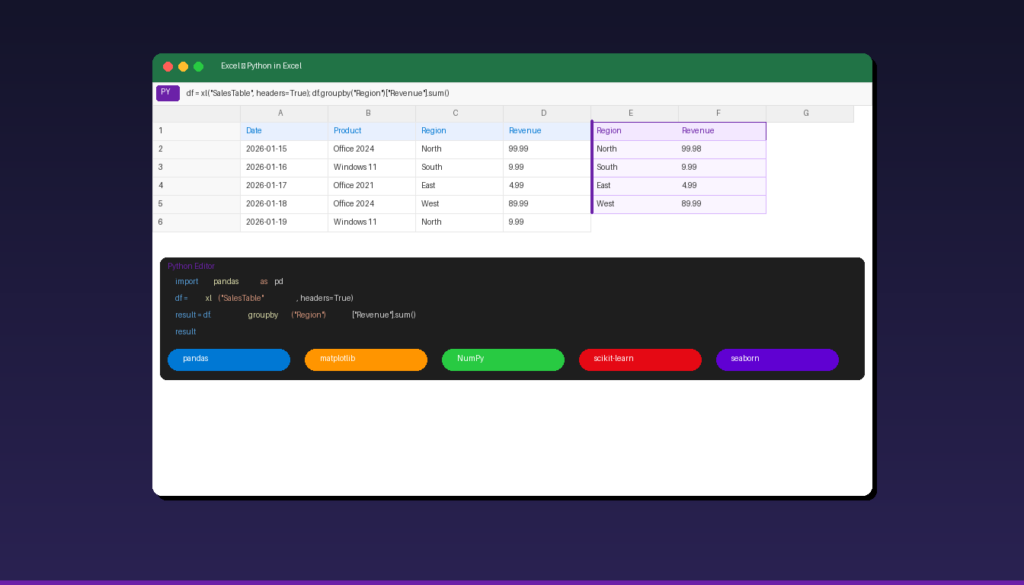
Practical Example: Analyze Sales Data
Assume you have sales data in cells A1:D50 (headers: Date, Product, Region, Revenue):
- Click cell F1 and type
=PY(. - Enter this code:
import pandas as pd
df = xl("A1:D50", headers=True)
summary = df.groupby("Region")["Revenue"].agg(["sum", "mean", "count"])
summary.columns = ["Total Revenue", "Avg Revenue", "Orders"]
summary
- Press Ctrl+Enter.
- The summary table spills into cells F1 and beyond, showing revenue totals by region.
The headers=True parameter tells Python to use the first row as column names. Without it, columns are numbered 0, 1, 2, 3.
What Python Libraries Are Available in Excel?
Python in Excel includes a curated Anaconda distribution with the most popular data science libraries pre-installed — you cannot install additional packages, but the included set covers most analysis needs.
| Library | Purpose | Example Use |
|---|---|---|
| pandas | Data manipulation and analysis | DataFrames, groupby, merge, pivot |
| NumPy | Numerical computing | Arrays, math operations, statistics |
| matplotlib | Basic plotting and charts | Line, bar, scatter, histogram |
| seaborn | Statistical visualization | Heatmaps, distribution plots, pair plots |
| scikit-learn | Machine learning | Regression, clustering, classification |
| SciPy | Scientific computing | Statistical tests, optimization |
| statsmodels | Statistical modeling | Regression analysis, time series |
| openpyxl | Excel file operations | Read/write Excel formats |
You cannot pip install additional packages. If you need a library that is not included, use a local Python installation with the xlwings or openpyxl package instead.
How Do I Create Visualizations With Python in Excel?
Use matplotlib or seaborn to create charts that render directly in Excel cells — Python plots appear as images that resize with the cell.
Bar Chart Example
- Click a cell and enter
=PY(. - Type:
import matplotlib.pyplot as plt
df = xl("A1:D50", headers=True)
revenue_by_region = df.groupby("Region")["Revenue"].sum()
fig, ax = plt.subplots(figsize=(6, 4))
revenue_by_region.plot(kind="bar", ax=ax, color=["#0078d4", "#28ca42", "#ff9500", "#6001d2"])
ax.set_title("Revenue by Region")
ax.set_ylabel("Revenue ($)")
plt.tight_layout()
plt.show()
- Press Ctrl+Enter.
The bar chart renders directly in the Excel cell. Resize the cell or merge cells to make the chart larger.
Visualization Comparison: Python vs Excel Charts
| Feature | Excel Charts | Python (matplotlib/seaborn) |
|---|---|---|
| Ease of use | Point-and-click | Code required |
| Chart types | 20+ built-in | Unlimited customization |
| Statistical plots | Limited | Heatmaps, violin, pair plots |
| Interactivity | Slicers, hover | Static images |
| Formatting | Ribbon tools | Code-based |
| Best for | Standard business charts | Advanced statistical analysis |
Use Excel charts for dashboards with slicers and interactivity. Use Python charts for statistical visualizations, custom styling, and analysis that Excel charts cannot produce natively. For Excel charting, see our Excel charts and graphs tutorial.
How Do I Use Python for Data Analysis in Excel?
Combine pandas operations with Excel data references to perform analysis that would require complex formulas or VBA in traditional Excel — grouping, merging, pivoting, and statistical testing in a few lines of code.
Common Analysis Patterns
Pivot Table Alternative:
df = xl("SalesTable", headers=True)
pivot = df.pivot_table(values="Revenue", index="Product", columns="Quarter", aggfunc="sum", fill_value=0)
pivot
Duplicate Detection:
df = xl("A1:E1000", headers=True)
duplicates = df[df.duplicated(subset=["Email"], keep=False)]
duplicates
Date-Based Analysis:
import pandas as pd
df = xl("SalesTable", headers=True)
df["Date"] = pd.to_datetime(df["Date"])
df["Month"] = df["Date"].dt.month_name()
monthly = df.groupby("Month")["Revenue"].sum().sort_values(ascending=False)
monthly
Statistical Summary:
df = xl("A1:D500", headers=True)
df.describe()
The describe() function returns count, mean, standard deviation, min, max, and quartiles for all numeric columns — replacing multiple Excel functions (AVERAGE, STDEV, MIN, MAX, QUARTILE) with one line.
What Are the Limitations of Python in Excel?
Python in Excel requires an internet connection, runs only on Microsoft 365 (not standalone Excel), and cannot access local files or install additional packages.
| Limitation | Impact | Workaround |
|---|---|---|
| Internet required | No offline Python execution | Use VBA or local Python for offline work |
| M365 only | Not in Excel 2024/2021/2019 | Upgrade to Microsoft 365 subscription |
| Windows only (GA) | Mac users limited to preview | Use Excel for web (limited) |
| No pip install | Cannot add custom packages | Use included Anaconda libraries |
| No local file access | Cannot read/write local files | Use xl() to reference Excel data only |
| Cloud execution | Data sent to Microsoft servers | Review data sensitivity before using |
| Performance | Cloud round-trip adds latency | Batch operations, minimize cell count |
| No VBA interaction | Python and VBA are separate | Use one or the other, not both |
For tasks requiring local file access, custom packages, or offline execution, use a local Python installation with openpyxl or xlwings instead of Python in Excel.
Python in Excel vs VBA: Which Should I Use?
Python in Excel is better for data analysis, statistics, and visualization — VBA is better for automating Excel tasks, creating custom functions, and building user interfaces.
| Feature | Python in Excel | VBA |
|---|---|---|
| Best for | Data analysis, ML, visualization | Automation, macros, UI |
| Learning curve | Moderate (Python syntax) | Moderate (VBA syntax) |
| Libraries | pandas, matplotlib, scikit-learn | Built-in Excel objects only |
| Execution | Cloud (internet required) | Local (no internet needed) |
| Speed | Slower (cloud round-trip) | Faster (local execution) |
| File access | Excel data only (via xl()) | Full local file system |
| Availability | M365 only | All Excel versions |
| Macros | No macro recording | Full macro support |
Use Python when you need pandas DataFrames, statistical analysis, or matplotlib charts. Use VBA when you need to automate repetitive tasks, create custom ribbon buttons, or build user forms. For VBA basics, see our Excel macros tutorial.
If you need Excel with Python support, a Microsoft 365 subscription is required. For standalone Excel with VBA and macro support (without Python), Microsoft Office 2024 Professional Plus ($199.99) includes the full Excel desktop application.
Frequently Asked Questions
Do I need to know Python to use Python in Excel?
Basic Python knowledge is helpful but not required for simple tasks. You can start with one-line operations like xl("A1:D50", headers=True).describe() for instant statistical summaries. For advanced analysis, familiarity with pandas and matplotlib is recommended. Microsoft provides built-in code samples accessible from the Formulas tab.
Is Python in Excel free?
Python in Excel is included with Microsoft 365 subscriptions at no additional cost. It is not available in standalone versions of Excel (2024, 2021, 2019). Microsoft 365 Personal starts at $6.99/month and includes Excel with Python, Word, PowerPoint, and 1 TB OneDrive storage.
Is my data safe when using Python in Excel?
Python code runs in isolated Microsoft Cloud containers with enterprise-grade security. Your data is processed in the cloud and results are returned to Excel. Microsoft states that data is handled according to the same compliance standards as other Microsoft 365 services. However, if you work with highly sensitive data, review your organization’s data policies before using cloud-based Python execution.
Can I share workbooks with Python formulas?
Yes. Recipients with Microsoft 365 can open the workbook and run Python cells. Recipients without Microsoft 365 see cached results (the last calculated values) but cannot execute or modify Python code. This means dashboards with Python remain viewable even for users without Python in Excel access.
by Editorial Team
Updated on April 5, 2026
by Editorial Team
Updated on April 5, 2026
ON THIS PAGE