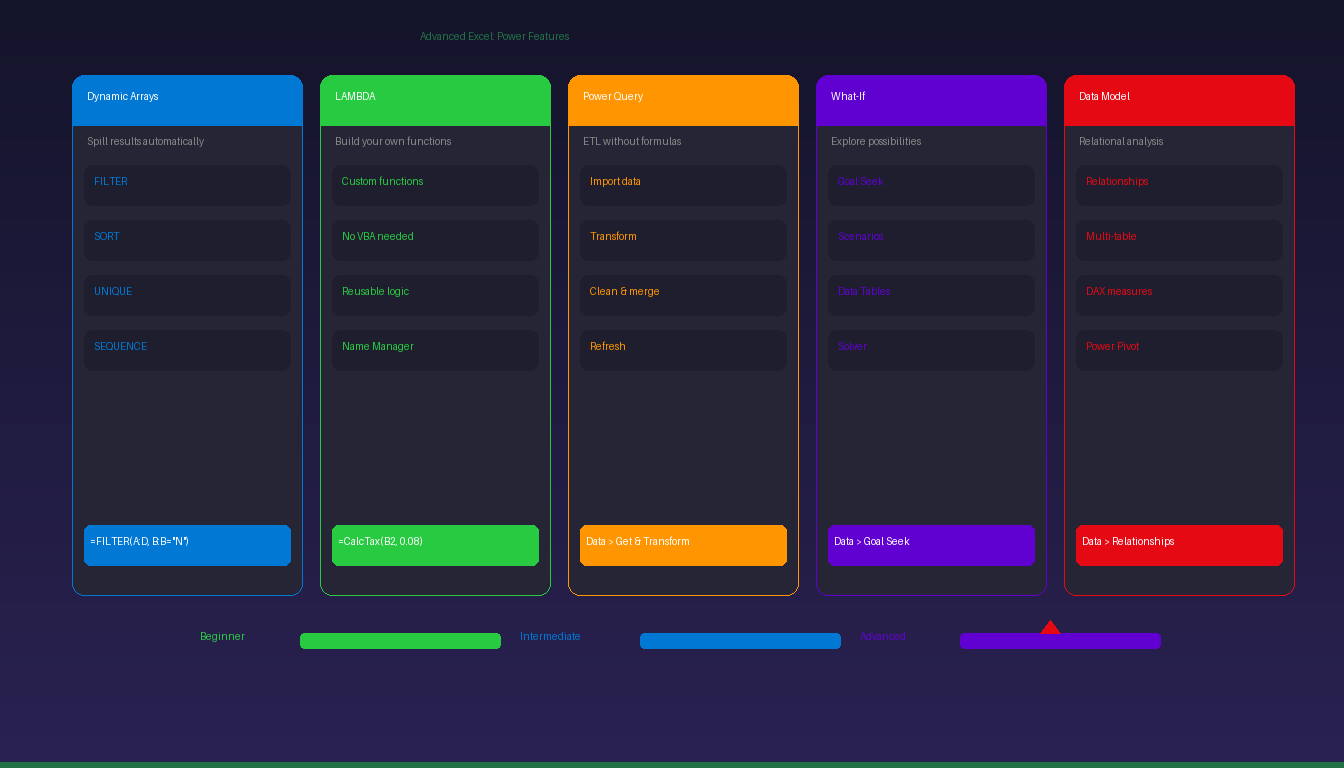
Advanced Excel goes beyond formulas and pivot tables into features that automate data transformation, create custom functions, and build relational data models. This tutorial covers dynamic arrays, LAMBDA functions, Power Query, What-If Analysis, and data modeling — the skills that separate Excel users from Excel power users. For prerequisite skills, see our intermediate Excel tutorial.
Key Takeaways
- Dynamic array functions (FILTER, SORT, UNIQUE, SEQUENCE) return multiple results from a single formula that automatically spill into adjacent cells.
- LAMBDA lets you create custom reusable functions without VBA — define once, use like any built-in function across the workbook.
- Power Query (Get & Transform Data) imports, cleans, and transforms data from external sources with repeatable, refreshable steps — replacing manual data cleanup.
What Are Dynamic Arrays in Excel?
Dynamic arrays are functions that return multiple values from a single formula — the results automatically spill into adjacent cells and resize when the source data changes.
Core Dynamic Array Functions
| Function | Syntax | What It Does | Example |
|---|---|---|---|
| FILTER | =FILTER(array, include) |
Returns rows matching criteria | =FILTER(A2:D100, B2:B100="North") |
| SORT | =SORT(array, [sort_index], [order]) |
Sorts a range | =SORT(A2:D100, 3, -1) (by col 3, descending) |
| SORTBY | =SORTBY(array, by_array, [order]) |
Sorts by another column | =SORTBY(A2:D100, D2:D100, -1) |
| UNIQUE | =UNIQUE(array) |
Returns unique values | =UNIQUE(B2:B100) |
| SEQUENCE | =SEQUENCE(rows, [cols], [start], [step]) |
Generates number series | =SEQUENCE(12, 1, 1, 1) → 1 through 12 |
| RANDARRAY | =RANDARRAY(rows, cols, min, max, whole) |
Random number array | =RANDARRAY(10, 1, 1, 100, TRUE) |
Combining Dynamic Arrays
Dynamic arrays become extremely powerful when combined:
=SORT(FILTER(SalesTable, SalesTable[Region]="North"), 4, -1)
This filters North region rows, then sorts by column 4 (Revenue) in descending order — all in one formula that updates automatically.
The Spill Operator (#)
Reference the entire spilled range of a dynamic array using the # operator:
=SUM(F2#)
If F2 contains a FILTER formula that spills into F2:F15, F2# references all 14 cells. The reference adjusts automatically as the spill range grows or shrinks.
Dynamic arrays are available in Microsoft 365 and Excel 2021+. They are not available in Excel 2019 or earlier.
How Do I Create Custom Functions With LAMBDA?
LAMBDA lets you define reusable custom functions with a formula — name them in the Name Manager and use them like built-in functions anywhere in the workbook.
Basic LAMBDA Syntax
=LAMBDA(parameter1, parameter2, calculation)
Example: Tax Calculator
Create a function that calculates tax:
- Go to Formulas > Name Manager > New.
- Name:
CalcTax - Refers to:
=LAMBDA(amount, rate, amount * rate) - Click OK.
Now use it anywhere: =CalcTax(B2, 0.08) returns the tax on B2 at 8%.
Example: Markup Price
Name: MarkupPrice
Refers to: =LAMBDA(cost, margin, cost / (1 - margin))
Usage: =MarkupPrice(50, 0.3) → returns $71.43 (30% margin on $50 cost).
LAMBDA vs VBA
| Feature | LAMBDA | VBA Macros |
|---|---|---|
| Syntax | Excel formula | VBA code |
| Learning curve | Low (if you know formulas) | High (programming required) |
| Security | No macro warnings | Requires enabling macros |
| Portability | Workbook-level only | Can be global |
| Debugging | Formula evaluation | VBA editor |
| Best for | Reusable calculations | Automation, UI, file operations |
LAMBDA replaces simple VBA user-defined functions (UDFs) with a formula-based approach that does not trigger macro security warnings. For automation beyond calculations, VBA remains necessary — see our Excel macros tutorial.
What Is Power Query and How Do I Use It?
Power Query (Get & Transform Data) imports data from external sources, applies transformation steps, and loads clean data into Excel — all with a visual interface and no formulas required.
Access Power Query
Go to Data tab > Get Data (or Get & Transform Data group).
Common Data Sources
| Source | How to Connect |
|---|---|
| CSV / Text files | Data > From Text/CSV |
| Excel workbooks | Data > From Workbook |
| Web pages | Data > From Web |
| Databases | Data > From Database (SQL, Access) |
| Folders | Data > From Folder (combine multiple files) |
Basic Transformation Steps
- Import: Data > From Text/CSV > select file > Load.
- Transform: Click Transform Data to open the Power Query Editor.
- Common transformations:
- Remove columns: Right-click header > Remove
- Filter rows: Click dropdown > filter criteria
- Change data type: Click header type icon > select type
- Split column: Right-click > Split Column > by delimiter
- Remove duplicates: Right-click > Remove Duplicates
- Merge queries: Home > Merge Queries (like a SQL JOIN)
- Load: Home > Close & Load to send clean data back to Excel.
Power Query vs Formulas
| Task | Formulas | Power Query |
|---|---|---|
| Clean data | TRIM, CLEAN, SUBSTITUTE per cell | One-click per column |
| Combine files | Manual copy-paste | From Folder (automatic) |
| Remove duplicates | Advanced formula or manual | Right-click > Remove Duplicates |
| Reshape data | Complex pivot formulas | Unpivot / Pivot columns |
| Refresh data | Re-enter formulas | Click Refresh (one button) |
| Repeatability | Must redo for new data | Steps saved, replayable |
Power Query is included in all Excel versions from 2016 onward.
How Do I Use What-If Analysis?
What-If Analysis tools help you explore different scenarios — Goal Seek finds the input needed for a desired output, Scenario Manager compares multiple sets of assumptions, and Data Tables show results across ranges of inputs.
Goal Seek
Find the input value needed to achieve a specific result:
- Go to Data > What-If Analysis > Goal Seek.
- Set cell: The formula cell you want to reach a target (e.g., Profit cell).
- To value: The target value (e.g., 50000).
- By changing cell: The input cell to adjust (e.g., Price cell).
- Click OK — Excel calculates the price needed for $50,000 profit.
Scenario Manager
Compare multiple sets of assumptions side-by-side:
- Go to Data > What-If Analysis > Scenario Manager.
- Click Add to create scenarios (e.g., “Best Case”, “Worst Case”, “Most Likely”).
- For each scenario, set the changing cell values.
- Click Summary to generate a comparison report.
Data Tables
Show formula results across a range of input values:
- Set up a formula that references an input cell.
- Create a row or column of input values to test.
- Select the table range including the formula and input values.
- Go to Data > What-If Analysis > Data Table.
- Specify the row/column input cell.
- Excel fills the table with results for each input value.
What Is the Excel Data Model?
The Data Model creates relationships between multiple tables — like a relational database inside Excel — enabling pivot tables that pull data from multiple sources without VLOOKUP.
Create Relationships
- Go to Data > Relationships > New.
- Select the two tables and the matching columns.
- Click OK.
- Create a PivotTable and check Add this data to the Data Model.
- The pivot table can now use fields from both related tables.
Data Model vs VLOOKUP
| Feature | VLOOKUP | Data Model |
|---|---|---|
| Connects | 2 ranges | Multiple tables |
| Performance | Slow on large data | Fast (columnar engine) |
| Maintenance | Formula per cell | Relationship defined once |
| Pivot table | Single source only | Multiple related sources |
| DAX measures | Not available | Custom calculations |
The Data Model is ideal when you have multiple related data tables (orders + customers + products) and need to analyze them together in pivot tables without merging everything into one flat table.
For more Excel analysis techniques, see our Excel pivot table tutorial and Excel Solver tutorial. If you need Excel with all advanced features including LAMBDA, dynamic arrays, and Power Query, Microsoft Office 2024 Professional Plus ($199.99) includes the full Excel desktop application.
Frequently Asked Questions
Which Excel version has all advanced features?
Microsoft 365 has every advanced feature including LAMBDA, dynamic arrays, REGEX functions, and Copilot AI. Excel 2024 includes most features except Copilot. Excel 2021 has dynamic arrays and XLOOKUP but not LAMBDA or REGEX. Excel 2019 and earlier lack dynamic arrays, LAMBDA, and XLOOKUP entirely.
Do I need to learn VBA if I know LAMBDA and Power Query?
For most data analysis tasks, LAMBDA and Power Query replace the need for VBA. LAMBDA handles custom calculations, and Power Query handles data transformation. VBA is still necessary for: automating repetitive tasks across workbooks, creating custom ribbon buttons and user forms, interacting with other applications (Outlook, Word), and file system operations (batch rename, folder processing).
What is the difference between Power Query and Power Pivot?
Power Query imports and transforms data (the “E” and “T” in ETL — Extract, Transform). Power Pivot creates a Data Model with relationships and DAX calculations (the “L” — Load and analyze). Use Power Query to clean data, then Power Pivot to build relationships and calculated measures for advanced pivot tables.
Can I use dynamic arrays in shared workbooks?
Yes, if all users have Excel versions that support dynamic arrays (Microsoft 365, Excel 2021+). Users with older versions will see #CALC! errors in cells containing dynamic array formulas. If backward compatibility is required, use traditional array formulas (Ctrl+Shift+Enter) or avoid dynamic arrays in shared files.